Accurate Top Views using Extraction Boxes
Using Sonatest’s unique extraction boxes, inspectors can directly extract the height and width of the flaw without any compromise.
Weld inspection data needs to be recorded if the full benefits of using the phased-array technique are to be obtained.
Full inspection data not only makes further analysis possible but it will also provide more clarity when identifying flaws. This advantage extends the use of phased array to allow inspectors to replace radiography under certain conditions (ASME Code, Section VIII, Division II). In this specific case, the rejection criteria of the inspection data are classified and based on a non-amplitude technique. In other words, it is no longer the echo amplitude that determines whether or not a flaw is rejected. Rather, it is the overall volumetric data (height and width). This is when an extraction box is very useful for further analysis of the inspection data.
Using Sonatest’s unique extraction boxes, inspectors can directly extract the height and width of the flaw without any compromise. Moreover, in both the TOP and END views, it is easy to accurately display the projected volumetric data of the weld in order to visualise the flaw and facilitate the interpretation.
|
|
|
|
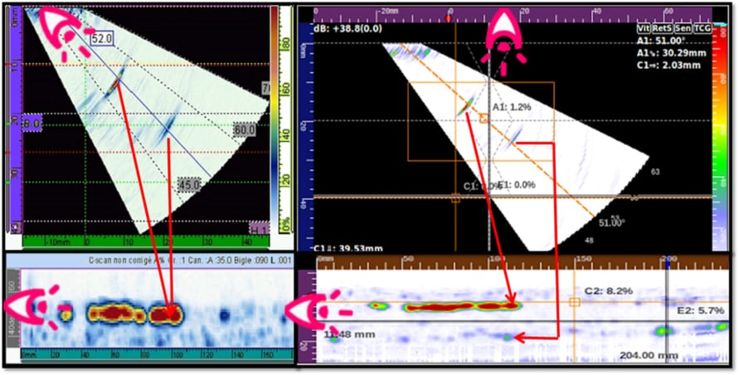
It is worth mentioning that most phase-array instruments cannot properly represent the projected volumetric data of the weld. These instruments’ projected view systems are not accurate as they are produced by simply re-aligning each A-Scan from the original angle to a fixed zero-degree angle. In many cases, this may hide information in the top view. Figure 1 above shows a compelling example of such a mistakenly hidden flaw. On the left, the top view is produced by re-aligning each beam. The line of view is indicated by the eye. On the other hand, on the right, the top view is fully reconstructed, sample by sample (or pixel by pixel) in such a way that the top view is then geometrically correct.
This then produces realistic imaging with an accurate geometrical representation and without mistakenly hiding flaws.
Another way to understand the difference between the two approaches is to refer to Figure 1. On both the left and right side, inspectors can apply a translation from the line of view in the S-Scan to the line of view in the lower portion of the image.
There are frequent cases in which hidden flaws may be present, which causes the inspector to miss a defect. Porosity, slag or a crack in the second skip of the sound path may be easily hidden by a geometrical root indication.
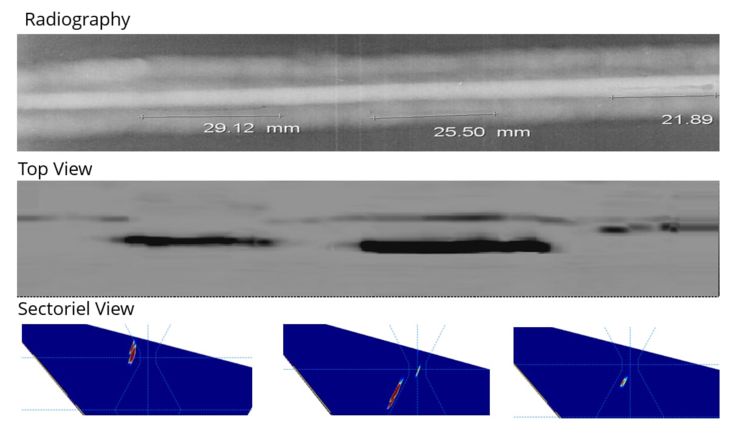
With respect to the above-mentioned ASME code, there is a significant benefit in ensuring a properly represented top view. With a geometrically accurate representation of the part in a top view and using a gray scale palette, it is then easy to generate a representation very similar to a radiograph (see Figure 2). In many cases, this helps inspectors who are used to radiography better understand and visualise the flaws using phased-array.
|
|
|
|