FMC/TFM Technique for Defect Characterisation
The TFM technique is not affected by the beam size; the algorithm creates a virtual focus on every pixel of the image.
Defect characterisation has always been a challenge for ultrasonic inspection techniques. Phased array has greatly enhanced the interpretation compared to conventional UT. However, some defects are still easily misinterpreted such as cracks with slag or lack of penetration depending on the geometry of the root.
The weld inspection field is vast and regulated by many standards. Most of them have different criteria according to the defect nature. For example, the ASME standard would allow defects under a certain dimension but will automatically reject cracks and lack of fusion. A proper characterisation may save money and increase public safety at the same time.
For now, the FMC/TMF technique is not regulated by standards which makes it difficult to apply on a day-to-day basis. The Sonatest solution offers a multiscan approach based on the Veo3 inspection instrument. This solution allows the user to keep using his rejection criteria for a weld inspection and, when in doubt about the nature of the defect, generate a high-resolution image with the FMC/TFM technique for a better assessment.
Figure 1 FMC/TFM inspection technique
Features & Benefits
- Exceptional resolution and precision for dimensional sizing
- FMC matrix recording which offers:
- Traceability to follow the defect progression
- Generation of TFM images with advanced modes
- Outstanding image resolution and signal-to-noise ratio
- Advanced analysis tools and automatic reports
- Remote control capability
FMC/TFM for Weld Inspection Assessment
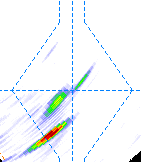
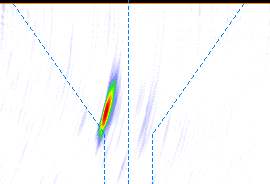
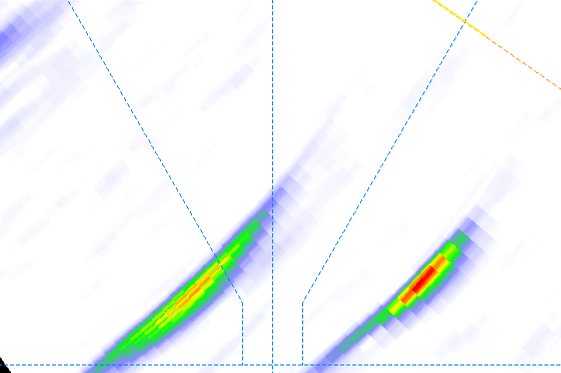
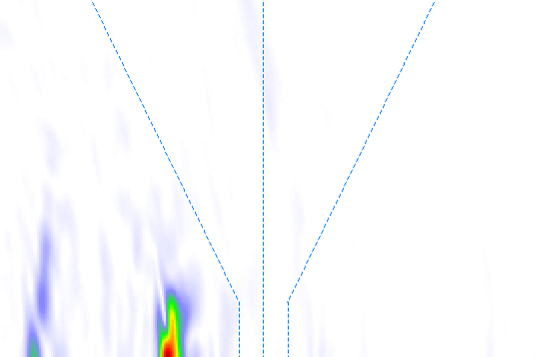
The TFM technique is not affected by the beam size; the algorithm creates a virtual focus on every pixel of the image. This offers an excellent sizing capability and provides a high resolution image for better characterisation. Figure 2 shows the difference between the PA and TFM TTTT (transversal to transversal send-receive propagation mode) techniques of a porosity cluster using the multiscan approach.
|
Figure 2 PA
|
vs. |
TFM TTTT
|
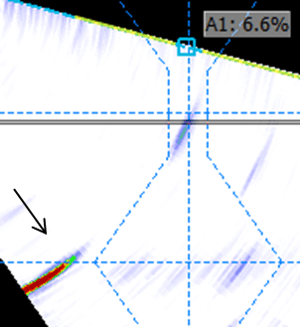
The FMC particular acquisition technique makes the TFM images less sensitive to the flaw orientation. Furthermore, the virtual focal point on every pixel of the TFM image increases the SNR. Both of those characteristics make this technique really efficient for a more precise sizing. Figure 3 shows the same crown crack measurement using PA and TFM inspections.
|
vs. |
TFM TTTT, 6mm
|
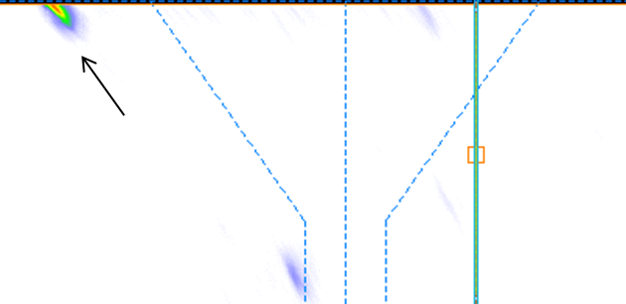
One of the benefits to keep the FMC matrix is to record the original A-scan. This feature allows the user to calculate the TFM image using more than one mode for one acquisition. Figure 4 shows a toe crack detected using both the PA and TFM TTT (transversal to transversal) techniques. TFM has been proven to be particularly sensitive to flaws perpendicular to the surface and one of the best ways to measure the defect height.
|
Figure 4 PA
|
vs. |
TFM TTT
|
Keeping the original data file (FMC matrix) allows the user to recalculate a TFM detection at different locations and for different thicknesses.
It is also interesting to note that it can be used with any equipment manufacturer. Indeed, TFM images include all the post processing information to enhance the image result that allows you to use it with different manufacturers.
For further information or support, please contact the Sonatest Applications Team: applications@sonatest.com
